In this post I am going to show you how you can use
PowerView using basic data model. In next post I will demonstrate how you can
use PowerView to visualise data from SQL Server, Analysis Service or other data
sources.
Assume we have following data in excel called “CountryNStates”
as shown below image:


Now add these tables into Data Model using option available
from ribbon as shown below image:

Once all your tables are added to data model, you can design
a Data Model with proper relationship. Below is shown for above two tables:

Now it’s time to create some PowerView report.
To add a PowerView report in Excel, go to “Insert” tab and
click on PowerView icon. You will see a new sheet for PowerView report. You
should also see all the tables you created in the data model.
Here is the snapshot of the report:

Without doing too much, PowerView provides, filters, auto
measures (i.e. SUM) etc. In above report the numbers are not formatted so I
will show you how to format numbers etc.
Go back to Data Model design page by clicking on Manage
button under “POWERPIVOT” tab and use formatting tab as shown below image:
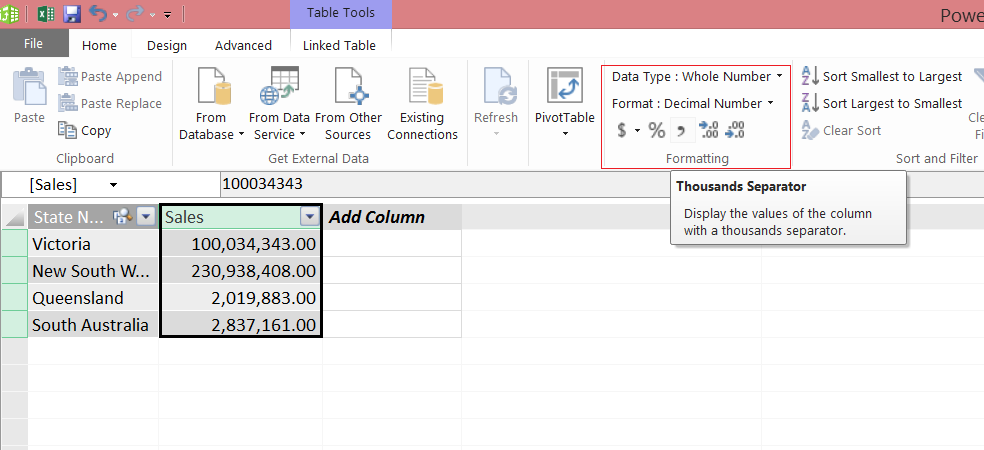
When you update it, Excel will prompt you in the report section
that you have updated you Data Model. Now refresh the report you will see the
numbers are formatted.

Now let’s add a measure that will show the percentage
contribution to sales. I will call it “% Sale”. Here we will be using DAX (Data
Analysis eXpression) to achieve this.
To create a measure, you need to go back to Data Modeling
page. The formula for percentage would be like below:
% Sale of Queensland = ( Total Sales for Queensland / Total
Sales in Australia ) * 100
Now let’s calculate it.
Below are measures in DAX:
Total Sales:=CALCULATE(SUM(Sales[Sales]),
ALL(Sales))
% of Sales:=SUM(Sales[Sales]) /
Sales[Total Sales]
Just make sure you need to display it
like percentage. You can do this by right clicking on the measure and selecting
formatting option then select “Percentage” option.
Once you have done this, you should see
following measures in Sales table under measures area as shown below:

The beauty of % Sale measure is that it
knows the context so we don’t need to say calculate % sale for Queensland etc.
Now add above % sales in the report. Here
is the final report after adding % sales.

Please leave your comments if you like or
dislike it. In next post I will show you how you can create BI Semantic Model
using Visual Studio and deploy it to Analysis Service – TABULAR and consume it
from PowerView in SharePoint environment.
That’s it for now. Happy SharePointing and
PowerViewing J